3. Cloudwatch Dashboards

🚀 Aspiring DevOps & Cloud Engineer | Passionate about Automation, CI/CD, Containers, and Cloud Infrastructure ☁️ I work with Docker, Kubernetes, Jenkins, Terraform, AWS (IAM & S3), Linux, Shell Scripting, and Git to build efficient, scalable, and secure systems. Currently contributing to DevOps-driven projects at Assurex e-Consultant while continuously expanding my skills through hands-on cloud and automation projects. Sharing my learning journey, projects, and tutorials on DevOps, AWS, and cloud technologies to help others grow in their tech careers. 💡 Let’s learn, build, and innovate together!
Dashboards in Cloudwatch
Welcome to this guide on AWS CloudWatch Dashboards. Here, you'll learn how to centralize monitoring across your infrastructure, customize views, and gain real-time insights—all in a single pane of glass.
Example Architecture
Imagine an AWS setup where a Virtual Private Cloud (VPC) spans two Availability Zones. Each zone hosts an Auto Scaling group with two EC2 instances. You’re sending instance metrics, VPC traffic stats, Auto Scaling health checks, and three alarms (Alarm 1, Alarm 2, Alarm 3) to CloudWatch.
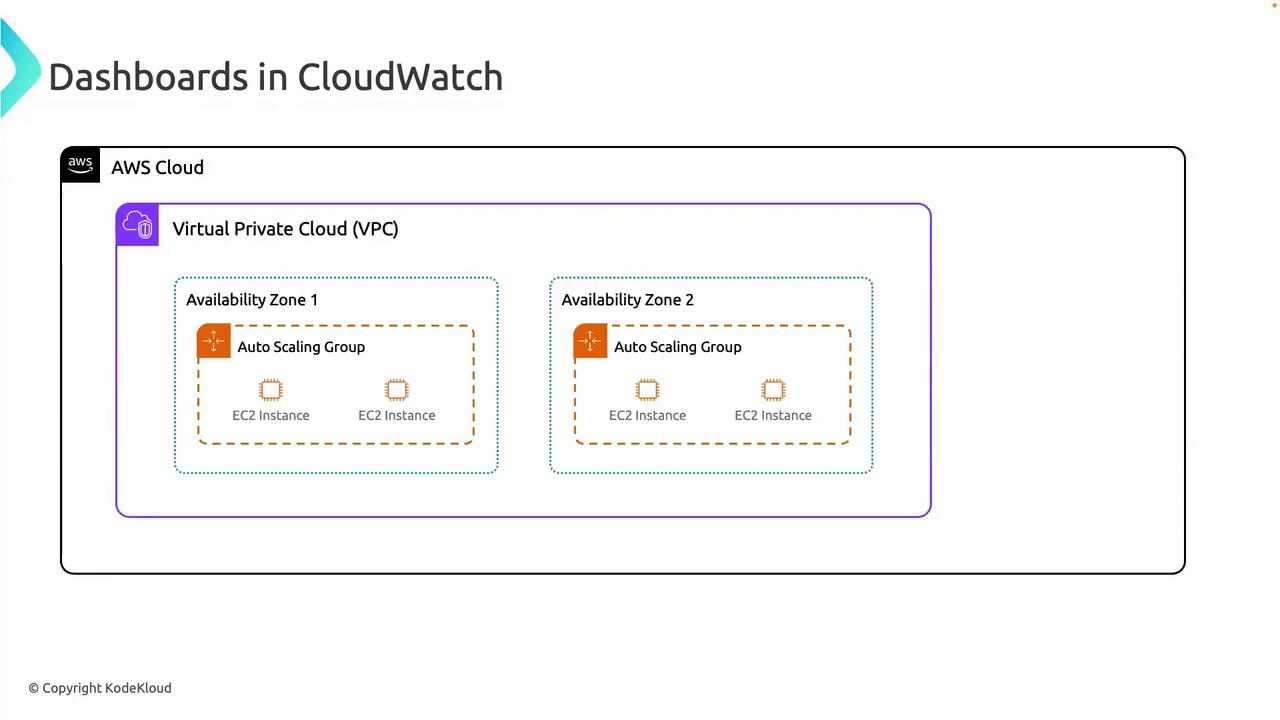
Instead of hopping between the EC2 console, Alarms tab, and VPC metrics, consolidate everything into a single CloudWatch Dashboard. This unified view becomes your application’s monitoring console.
Key Benefits of CloudWatch Dashboards
| Benefit | Description |
| Customizable Views | Drag-and-drop metrics, logs, and widgets to build the perfect layout. |
| Real-Time Metrics | Automatically refresh charts for up-to-the-minute visibility. |
| Multi-Resource Monitoring | Aggregate data from EC2, RDS, Lambda, and more on one screen. |
| Interactive Charts | Drill down, zoom, and slice time ranges to investigate anomalies. |
| Secure Sharing | Use IAM to grant view/edit permissions at the dashboard level. |
| Cost Control | Pay only for the dashboards and widgets you create. |
1. Customizable Monitoring Views
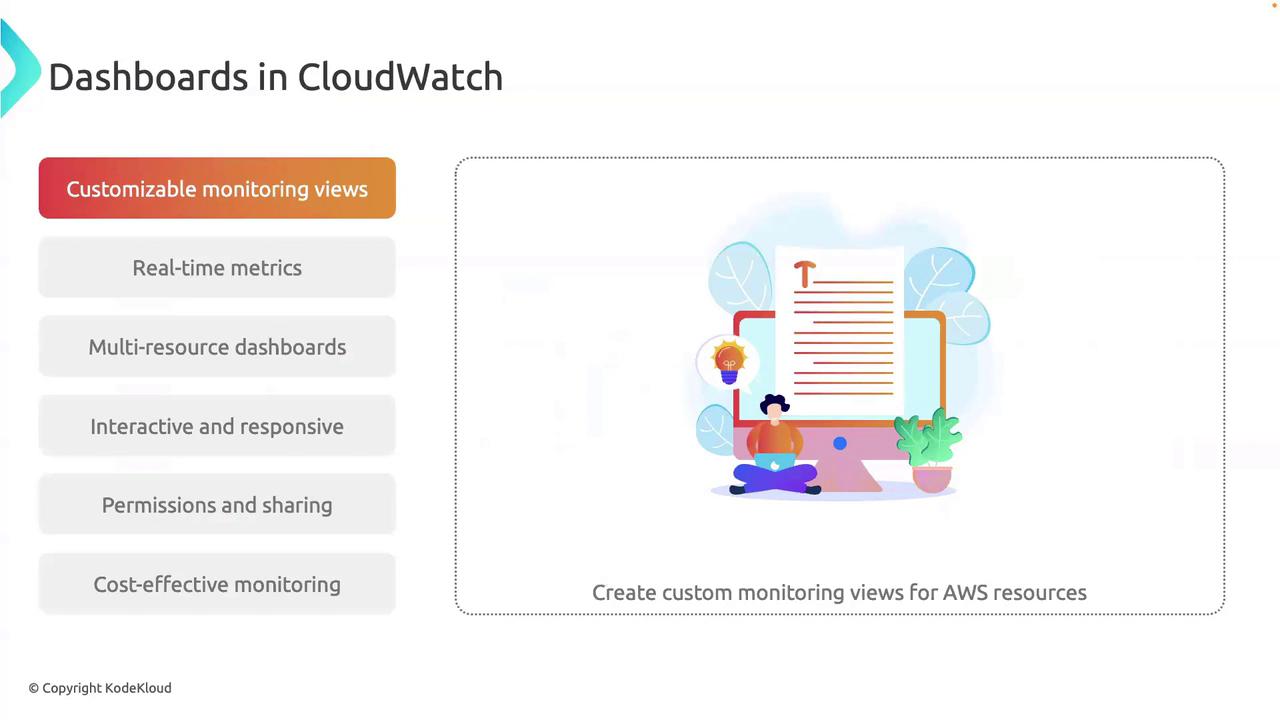
Design dashboards that reflect your operational needs. Combine standard metrics, logs, or even custom widgets—limitless flexibility through a drag-and-drop canvas.
Note
You can embed text, images, and markdown in custom widgets to provide context or instructions directly on your dashboard.
2. Real-Time Metrics
Get continuous updates without manual refresh. Real-time metrics empower you to detect and respond to issues immediately, minimizing downtime.
3. Multi-Resource Monitoring
Aggregate metrics from EC2, RDS, Lambda, DynamoDB, and custom namespaces—all on one dashboard. Track your entire application stack side by side.
4. Interactive and Responsive
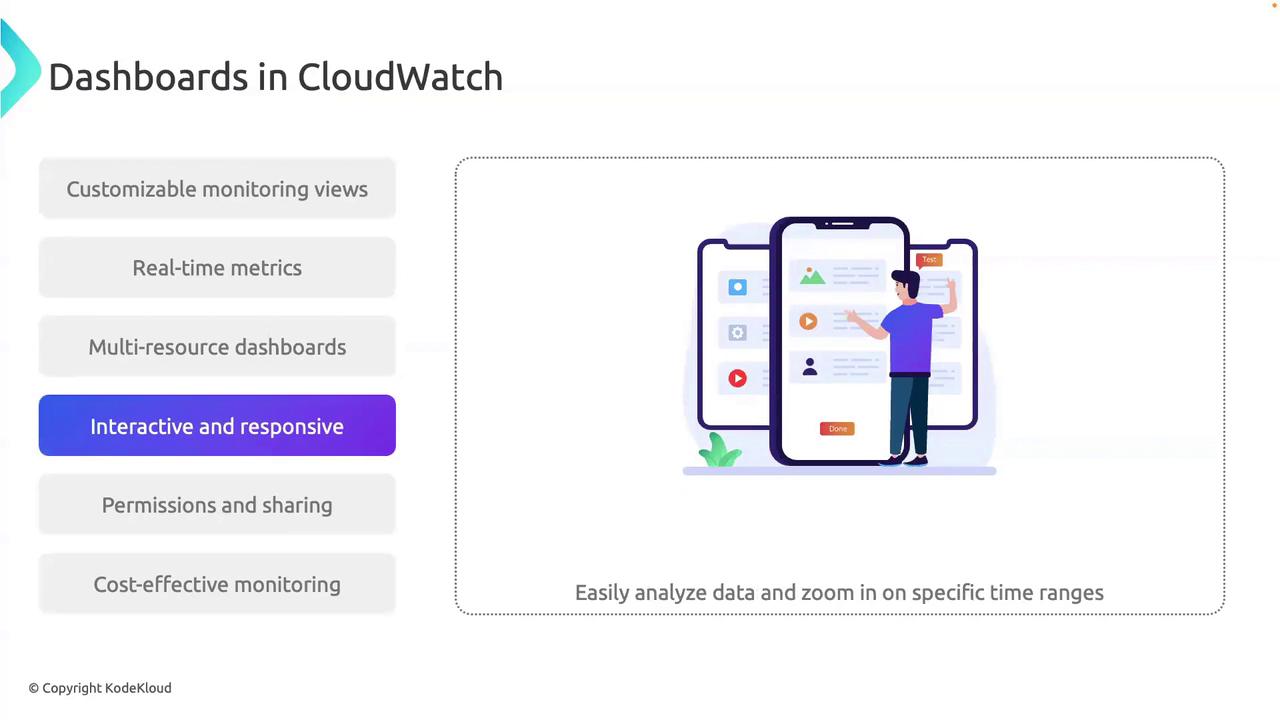
Dashboards are fully interactive: click a data point to jump into the logs, zoom into specific time windows, or filter by dimension. Built with responsive design, they render perfectly on desktops, tablets, and smartphones.
5. Collaboration and Sharing
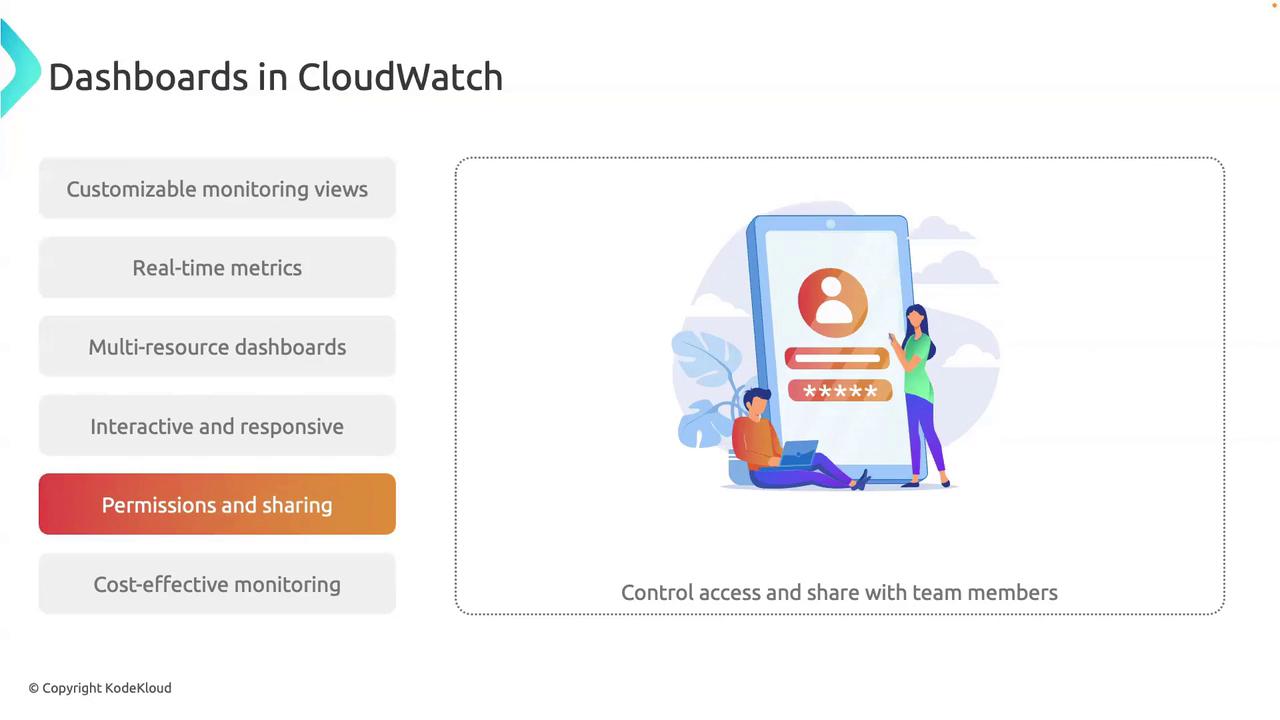
Control who can view or modify each dashboard using AWS Identity and Access Management (IAM). Grant teams only the permissions they need, ensuring security and compliance.
Warning
Over-communicating permissions can lead to unintended access. Always follow the principle of least privilege when configuring IAM roles for dashboards.
6. Cost-Effective Monitoring
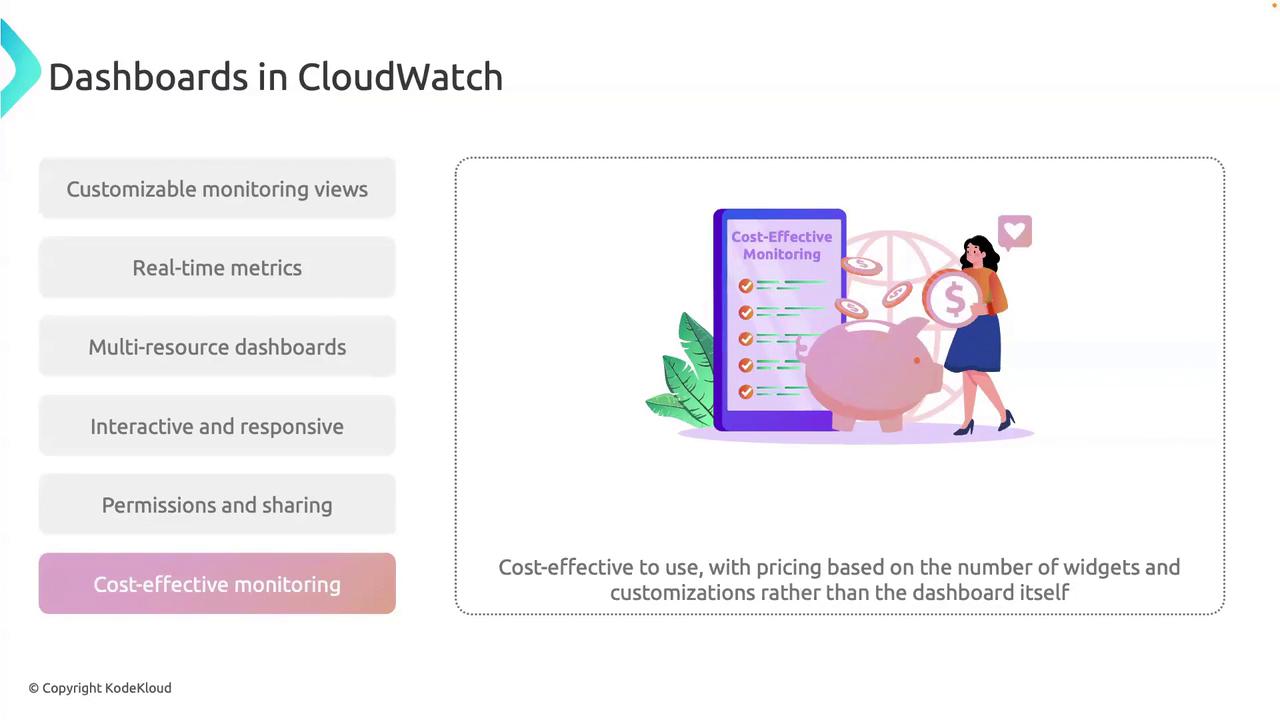
AWS CloudWatch Dashboards use a pay-as-you-go model. You incur charges only for the number of dashboards and custom widgets you create.
Summary
By leveraging AWS CloudWatch Dashboards, you can:
Consolidate metrics, logs, and alarms in a single pane
Build custom layouts tailored to your workflows
Monitor in real time across heterogeneous resources
Interactively drill down into data for root-cause analysis
Securely share dashboards with fine-grained IAM controls
Optimize costs with a flexible, usage-based pricing model
Start building dashboards today to gain unified visibility and faster incident response across your AWS environment.
Different types of Visualizations
Welcome back! In the previous lesson, we explored the benefits of AWS CloudWatch Dashboards for visualizing your metrics. Now, we'll dive into the variety of visualization widgets available, explain their use cases, and show you when to choose each type for maximum insight.
Note
Combining different widget types on a single dashboard helps you correlate trends, anomalies, and operational events in one view.
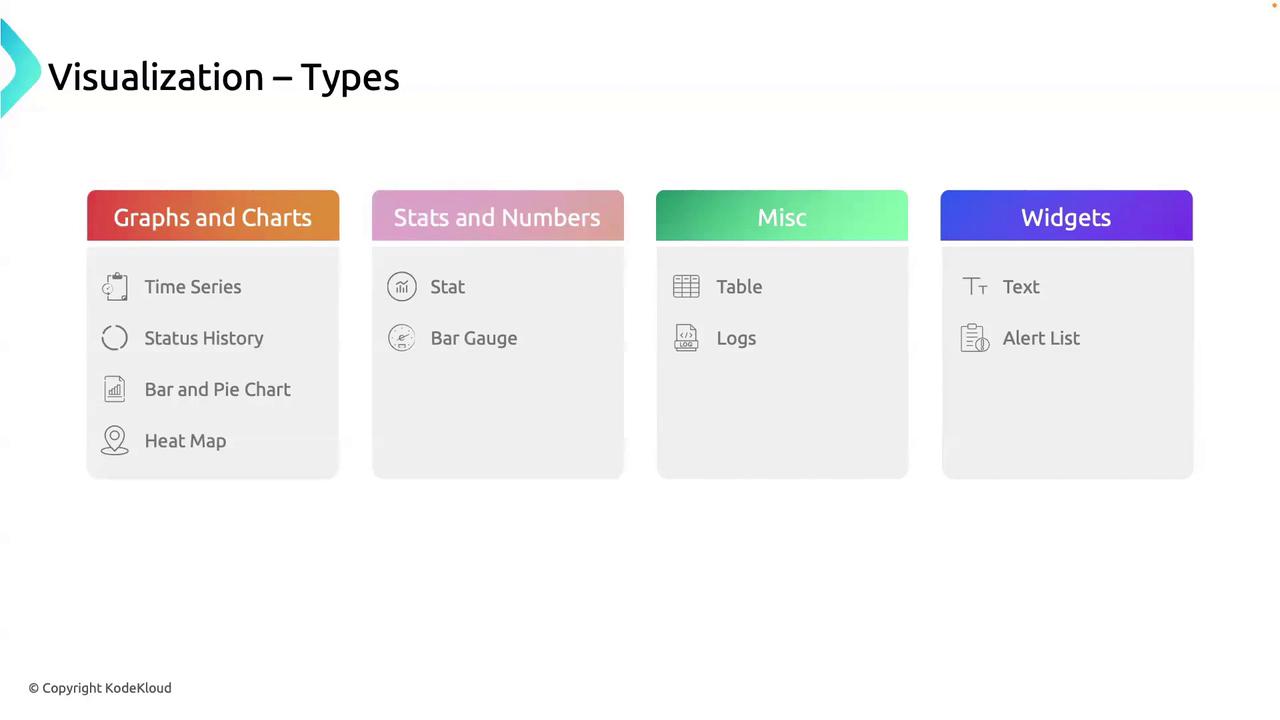
1. Graphs and Charts
Graphs and charts are essential when you need to track changes and compare metrics over time.
Time Series Graph
Track metrics across a continuous time window.
Use case: Plot HTTP request counts over the last 24 hours to identify traffic spikes and troughs.Status History Graph
Visualize state transitions along a timeline.
Use case: Monitor CI/CD pipeline statuses—successes, failures, and in-progress builds.Bar Chart
Compare discrete categories side by side.
Use case: Contrast average response times for different microservices.Pie Chart
Show proportional distributions.
Use case: Display the percentage of GET vs. POST vs. PUT requests your API handles.Heat Map
Highlight intensity across two dimensions.
Use case: View CPU utilization across Auto Scaling group instances during peak load.
2. Stats and Numeric Widgets
For at-a-glance figures and threshold monitoring, consider these widgets:
| Widget | Description | Example |
| Stat Widget | Single numeric value, perfect for key metrics | Current count of running EC2 instances |
| Gauge / Bar | Value against thresholds | Disk I/O utilization nearing a defined critical limit |
Warning
Avoid overcrowding your dashboard with too many stat widgets—focus on the metrics that drive your operations.
3. Miscellaneous Widgets
Use these to consolidate data in tables or stream log output:
| Widget | Description | Example |
| Table | Tabular display of multiple metrics or query results | Recent deployment durations for each microservice |
| Log Query Widget | Real-time log entries from CloudWatch Logs Insights | Latest error messages filtered by application name and severity |
4. Text and Alert Widgets
Annotations and alert overviews keep your team informed:
Text Widget
Add Markdown or plain text to document schedules, notes, or context for other elements.Alert List
Display active alarms for monitored resources.
Use case: Quickly see build failures or service outages in your CI/CD pipeline.
By selecting the right combination of these visualization types, you can tailor your CloudWatch Dashboard to meet your monitoring goals, accelerate troubleshooting, and maintain operational excellence.
Demo Hands on with Cloudwatch Dashboards
In this tutorial, you’ll learn how to provision infrastructure with CloudFormation, deploy a Python application on EC2 that writes to DynamoDB, generate load, and build a centralized AWS CloudWatch dashboard with various widget types.
1. Provision Base Infrastructure with CloudFormation
First, use a CloudFormation template to create the EC2 instance, IAM role, and instance profile.
1.1 CloudFormation Template Overview
This template (cloudwatch_dashboard_cloudformation.yaml) provisions:
A t2.micro EC2 instance (Amazon Linux 2).
An IAM role with full EC2, DynamoDB, and SSM permissions.
An instance profile to attach the role to the instance.
| Resource | Type | Details |
| EC2 Instance | AWS::EC2::Instance | t2.micro, Amazon Linux 2, uses SSM Session Manager |
| IAM Role | AWS::IAM::Role | Full access to EC2, DynamoDB, and SSM |
| IAM Instance Profile | AWS::IAM::InstanceProfile | Binds the IAM role to the EC2 instance |
# cloudwatch_dashboard_cloudformation.yaml
Parameters:
  LatestAmiId:
    Type: AWS::SSM::Parameter::Value<AWS::EC2::Image::Id>
    Default: /aws/service/ami-amazon-linux-latest/amzn2-ami-hvm-x86_64-gp2


Resources:
  MyEC2Instance:
    Type: AWS::EC2::Instance
    Properties:
      ImageId: !Ref LatestAmiId
      InstanceType: t2.micro
      IamInstanceProfile: !Ref InstanceProfile


  InstanceProfile:
    Type: AWS::IAM::InstanceProfile
    Properties:
      Roles:
        - Ref: EC2DynamoDBRole


  EC2DynamoDBRole:
    Type: AWS::IAM::Role
    Properties:
      AssumeRolePolicyDocument:
        Version: "2012-10-17"
        Statement:
          - Effect: Allow
            Principal:
              Service: ec2.amazonaws.com
            Action: sts:AssumeRole
      Policies:
        - PolicyName: EC2DynamoDBSSMFullAccess
          PolicyDocument:
            Version: "2012-10-17"
            Statement:
              - Effect: Allow
                Action:
                  - ec2:*
                  - dynamodb:*
                  - ssm:*
                Resource: '*'


Outputs:
  EC2InstanceID:
    Description: 'ID of the newly created EC2 instance'
    Value: !Ref MyEC2Instance
Open the AWS CloudFormation console.
Click Create stack → With new resources (standard).
Under Template source, select Upload a template file, choose the YAML above, then Next.
Enter CloudWatch-Dashboard-App01 as the stack name, accept defaults, acknowledge IAM changes, and click Create stack.
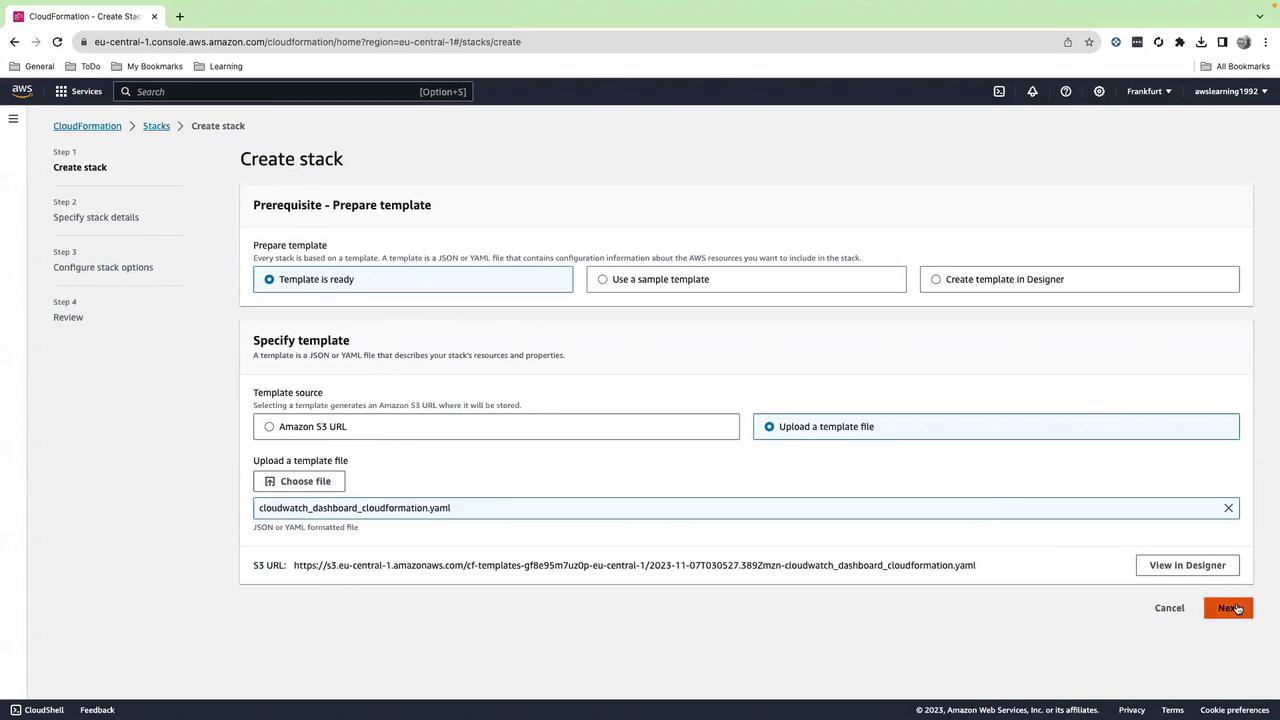
Wait until the stack reaches CREATE_COMPLETE.
Note
Make sure you deploy in the same AWS Region where you intend to run your workloads.
2. Verify EC2 Instance and IAM Role
Open the EC2 console.
Confirm your t2.micro instance is running.
Under Security → IAM role, ensure
EC2DynamoDBRoleis attached.
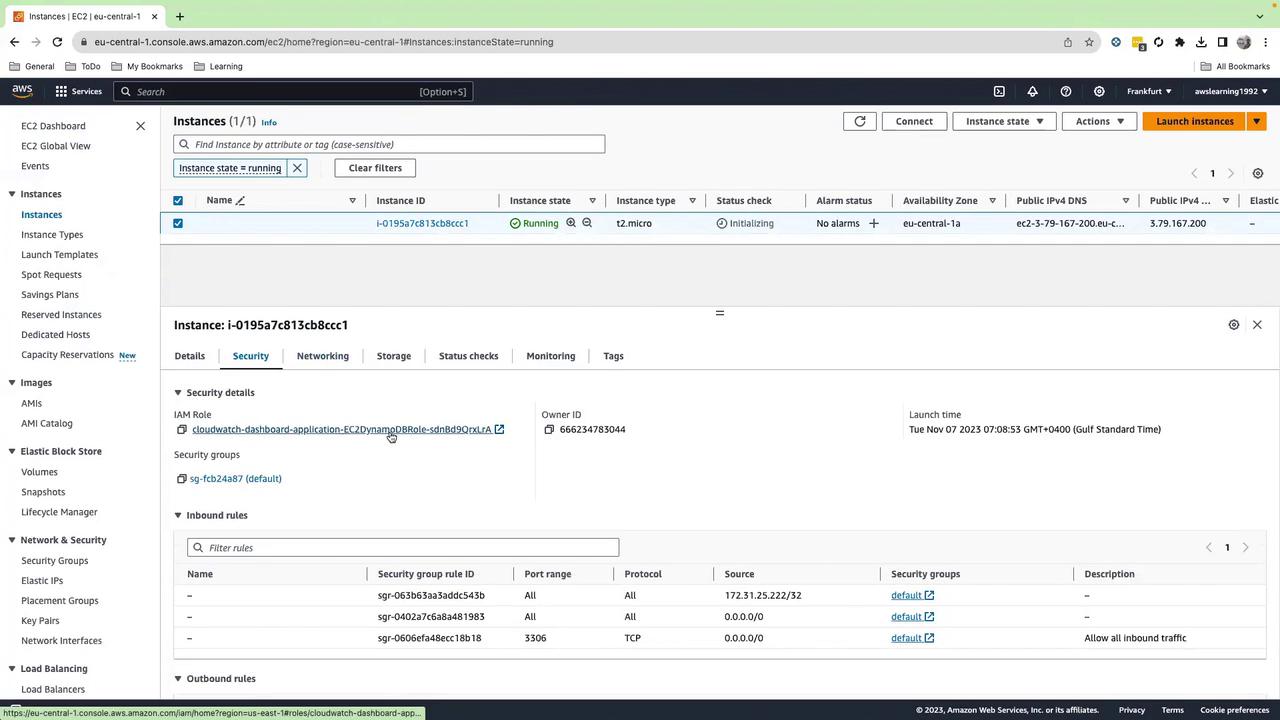
3. Connect via Session Manager
Use AWS Systems Manager Session Manager to get a shell without SSH keys:
In the EC2 console, select the instance.
Click Connect → Session Manager → Connect.
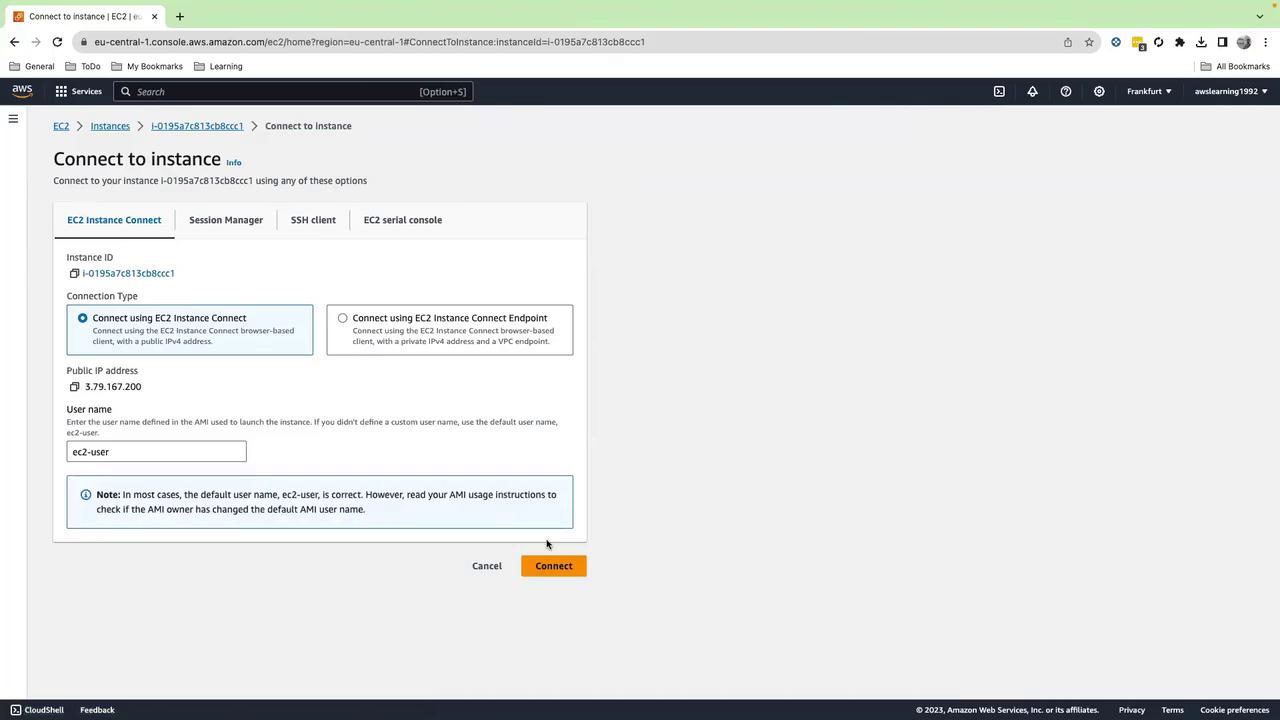
Once connected, switch to root and navigate:
sudo su -
cd /home/ec2-user
4. Install Dependencies and Deploy Sample Application
4.1 Install pip
curl -O https://bootstrap.pypa.io/get-pip.py
python3 get-pip.py
4.2 Install stress
yum install -y stress
4.3 Prepare the Application Directory
mkdir -p application_01 && cd application_01
cat > requirements.txt <<EOF
boto3
EOF
pip3 install -r requirements.txt
4.4 Create the Python Application
In application_01/app.py:
# application_01/app.py
import boto3
from botocore.exceptions import ClientError
import random, time, decimal


dynamodb = boto3.resource('dynamodb')
order_rand = random.Random()
item_rand = random.Random()
quant_rand = random.Random()


def create_table(name):
    try:
        table = dynamodb.create_table(
            TableName=name,
            KeySchema=[{'AttributeName': 'order_id', 'KeyType': 'HASH'}],
            AttributeDefinitions=[{'AttributeName': 'order_id', 'AttributeType': 'S'}],
            ProvisionedThroughput={'ReadCapacityUnits': 5, 'WriteCapacityUnits': 5}
        )
        table.wait_until_exists()
        print(f"Table {name} created successfully.")
    except ClientError as e:
        if e.response['Error']['Code'] == 'ResourceInUseException':
            print(f"Table {name} already exists.")
        else:
            print(f"Unexpected error: {e}")


def put_random_shopping_data(name):
    table = dynamodb.Table(name)
    count = 0
    while True:
        order_id = str(order_rand.randint(1, 100000))
        item_name = f"item_{item_rand.randint(1, 100)}"
        quantity = quant_rand.randint(1, 20)
        price = decimal.Decimal(round(random.random()*1000, 2))
        table.put_item(Item={
            'order_id': order_id,
            'item_name': item_name,
            'quantity': quantity,
            'price': price
        })
        print(f"PutItem succeeded: {order_id}, {item_name}, {quantity}, {price}")
        count += 1
        if count % 100 == 0:
            print("Sleeping for 1 minute...")
            time.sleep(60)


if __name__ == '__main__':
    table_name = 'ShoppingData'
    create_table(table_name)
    put_random_shopping_data(table_name)
Run the application:
python3 app.py
# Output will confirm table creation and ongoing PutItem calls
Warning
This script runs indefinitely until you stop it (Ctrl+C).
5. Verify DynamoDB Table
In the DynamoDB console, under Tables, confirm ShoppingData is active:
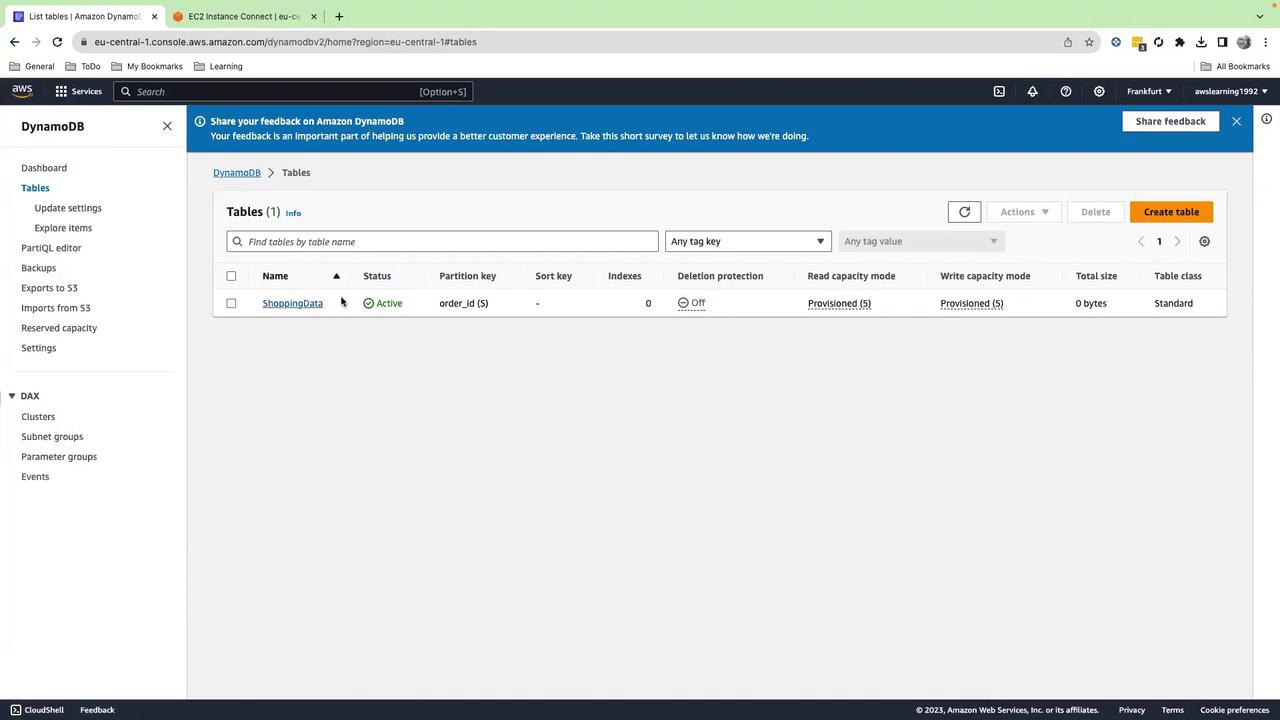
6. Apply Load with a Stress Script
Open a new Session Manager tab to keep app.py running, then:
cat > stress_test.sh <<'EOF'
#!/bin/bash
# Disk Stress
dd if=/dev/zero of=/tmp/testfile bs=1M count=100 iflag=fullblock
# CPU Stress (2 cores, 60s)
stress --cpu 2 --timeout 60
# Memory Stress (2 VMs, 128MB each, 60s)
stress --vm 2 --vm-bytes 128M --timeout 60
EOF


bash stress_test.sh
This generates CPU, memory, and disk activity on the instance.
7. Build Your CloudWatch Dashboard
Open CloudWatch → Dashboards → Create dashboard.
Name it Application-01 and click Create dashboard.
For each widget, choose Add widget and select the type.
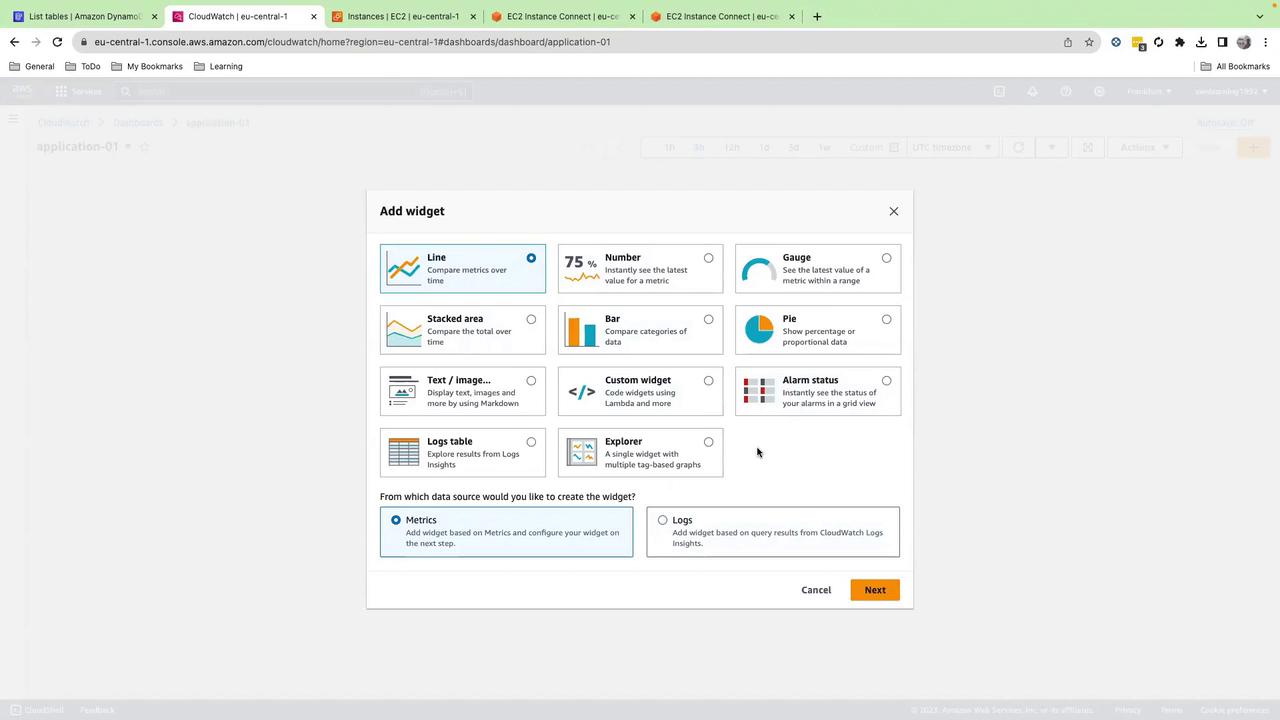
7.1 EC2 CPU Metrics (Line Chart)
Browse Metrics → EC2 → Per-Instance Metrics.
Select your instance, then check:
CPUUtilization
CPUCreditBalance
CPUSurplusCreditBalance
CPUSurplusCreditsCharged
Set Time range to 1 hour, click Create widget.
Enable Autosave and rename to EC2 CPU Metrics.
7.2 Dashboard Header (Text/Markdown)
Add Text widget, choose Markdown, and enter:
  # Application 01 Dashboard
  **On-Call:** ops@example.com
Click Create widget and drag it to the top.
7.3 DynamoDB Latency (Number Widget)
Add Number widget.
Browse DynamoDB → TableMetrics → ShoppingData → SuccessfulRequestLatency.
Click Create widget.
7.4 DynamoDB Consumed Write Capacity (Line Chart)
Add Line widget.
Browse DynamoDB → TableMetrics → ShoppingData → ConsumedWriteCapacityUnits.
Click Create widget.
7.5 EC2 CPU Utilization Gauge
Add Gauge widget.
Browse EC2 → Per-Instance Metrics → your instance → CPUUtilization.
Set Min=0, Max=100, click Create widget.
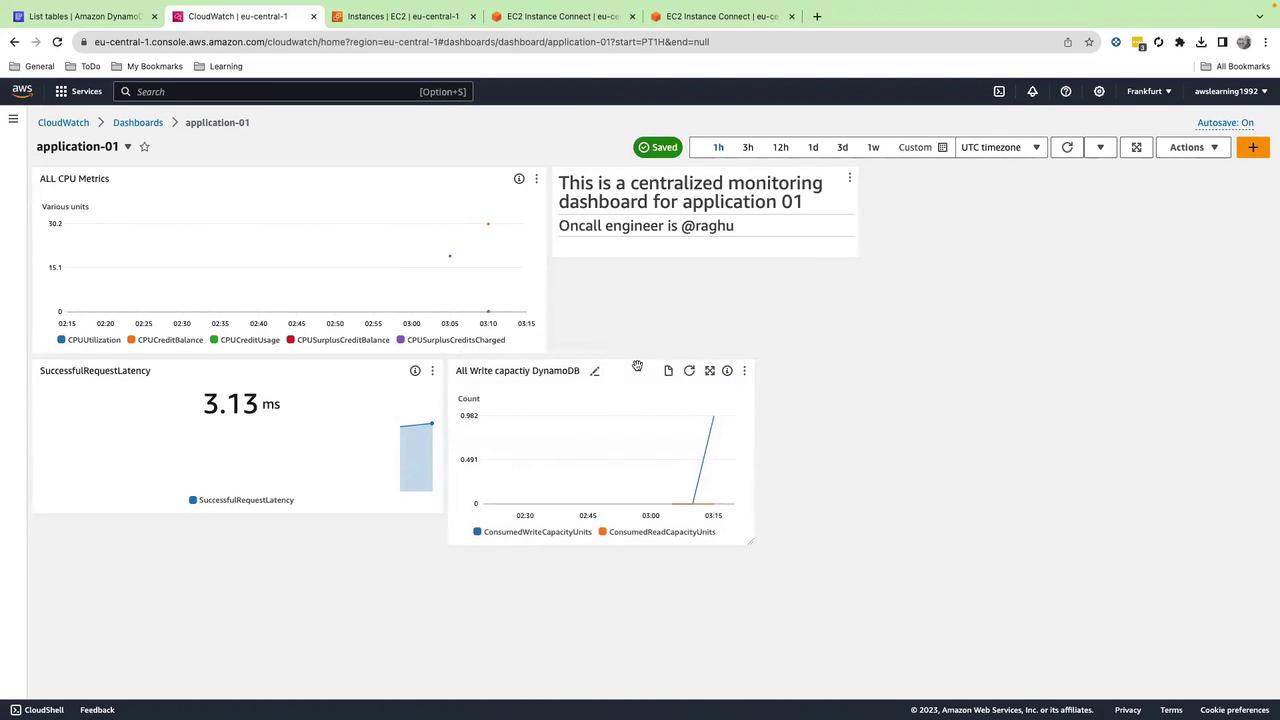
Your dashboard should now look like this:
7.6 Alarm Status (Alarm Status Widget)
In CloudWatch → All alarms → Create alarm.
Select EC2 → Per-Instance Metrics → CPUUtilization.
Set threshold \>= 90%, configure an SNS topic for notifications.
Complete the wizard.
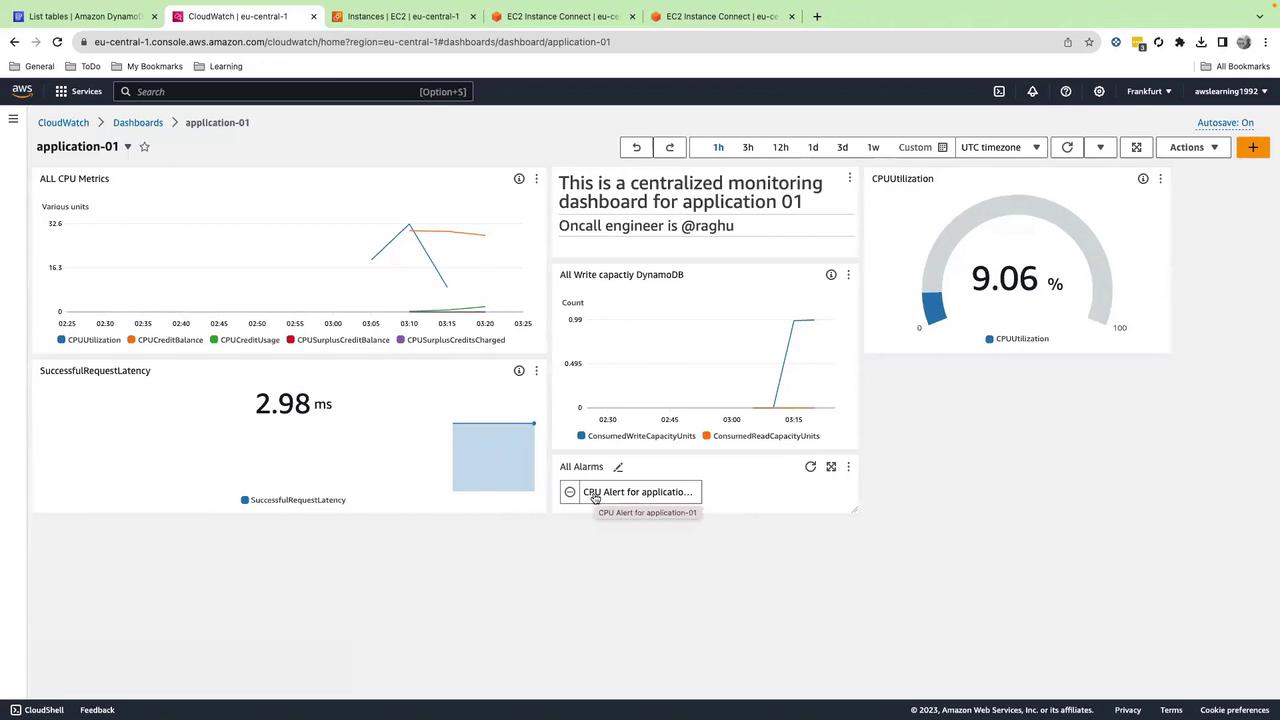
Back in your dashboard, add an Alarm status widget, select your new alarm, and click Create widget.
Now you’ll see live alarm indicators:
8. Cleanup
To avoid ongoing charges, delete:
The CloudFormation stack.
The CloudWatch dashboard.
Any SNS topics and alarms you created.
The DynamoDB table if no longer needed.


